| |
|
|
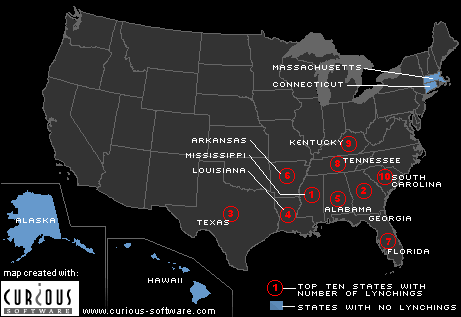
Lynching Statistics
|
State and Race, 1882-1968*
Lynching
Statistics by State
|
|

State and Race, 1882-1968*
|
|
|
|
State
|
White
|
Black
|
Total
|
|
|
|
Alabama
|
48
|
299
|
347
|
|
Arizona
|
31
|
0
|
31
|
|
Arkansas
|
58
|
226
|
284
|
|
California
|
41
|
2
|
43
|
|
Colorado
|
65
|
3
|
68
|
|
Delaware
|
0
|
1
|
1
|
|
Florida
|
25
|
257
|
282
|
|
Georgia
|
39
|
492
|
531
|
|
Idaho
|
20
|
0
|
20
|
|
Illinois
|
15
|
19
|
34
|
|
Indiana
|
33
|
14
|
47
|
|
Iowa
|
17
|
2
|
19
|
|
Kansas
|
35
|
19
|
54
|
|
Kentucky
|
63
|
142
|
205
|
|
Louisiana
|
56
|
335
|
391
|
|
Maine
|
1
|
0
|
1
|
|
Maryland
|
2
|
27
|
29
|
|
Michigan
|
7
|
1
|
8
|
|
Minnesota
|
5
|
4
|
9
|
|
Mississippi
|
42
|
539
|
581
|
|
Missouri
|
53
|
69
|
122
|
|
Montana
|
82
|
2
|
84
|
|
Nebraska
|
52
|
5
|
57
|
|
Nevada
|
6
|
0
|
6
|
|
New
Jersey
|
1
|
1
|
2
|
|
New
Mexico
|
33
|
3
|
36
|
|
New
York
|
1
|
1
|
2
|
|
North
Carolina
|
15
|
86
|
101
|
|
North
Dakota
|
13
|
3
|
16
|
|
Ohio
|
10
|
16
|
26
|
|
Oklahoma
|
82
|
40
|
122
|
|
Oregon
|
20
|
1
|
21
|
|
Pennsylvania
|
2
|
6
|
8
|
|
South
Carolina
|
4
|
156
|
160
|
|
South
Dakota
|
27
|
0
|
27
|
|
Tennessee
|
47
|
204
|
251
|
|
Texas
|
141
|
352
|
493
|
|
Utah
|
6
|
2
|
8
|
|
Vermont
|
1
|
0
|
1
|
|
Virginia
|
17
|
83
|
100
|
|
Washington
|
25
|
1
|
26
|
|
West
Virginia
|
20
|
28
|
48
|
|
Wisconsin
|
6
|
0
|
6
|
|
Wyoming
|
30
|
5
|
35
|
|
Total
|
1,297
|
3,446
|
4,743
|
|
|
|
|
|
|
*Statistics provided the author by
the Archives at Tuskegee Institute, Febuary 1979.
The data do not specify victims by ethnicity or by race
other than black or white.
|
|
|
|
|


